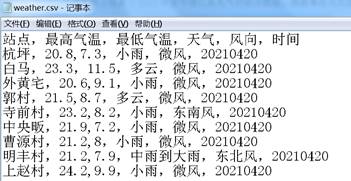
 图1
图1
为了分析各站点的天气情况,小李编写了如下Python程序。
import pandas as pd
import matplotlib.pyplot as plt
df=pd.read_csv("weather.csv")
print()
df2=df.groupby("站点").max() #对“站点”进行分组,并计算各组数据的最大值
plt.figure(figsize=(10,5))
plt.bar(,df2.最高气温)
plt.title("2021年至今某县各站点最高气温情况")
plt.xlabel("站点")
plt.ylabel("最高气温")
plt.show()
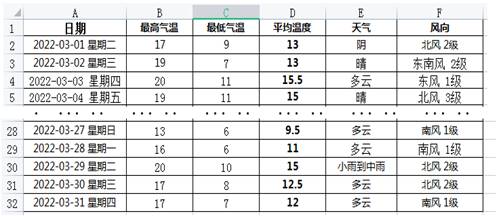
 图2
图2
区域D2:D32的数据是通过公式计算得到,在D2单元格输入公式,并应用自动填充功能完成区域D3:D32的计算,则D2单元格中的公式是。
df=pd.read_excel("pjtq202203.xls")
max= ![]() ①
①
for i in range(2,len(df)):
if abs(int(df["平均温度"][i])-int(df["平均温度"][i-1]))> ![]() : ②
: ②
max=i
print("平均温度变化最大的日期区间是:"+df["日期"][max-1]+"---"+df["日期"][max])