#导入 Flask 框架模块及其他相关模块,代码略
app=Flask(__name__)
@app.route("/")
def index():
#从数据库读取温度和湿度数据,并返回页面,代码略
@app.route("/search")
def search():
#根据日期查询相应数据,并返回页面,代码略
#服务器其他功能,代码略

import pandas as pd
import matplotlib.pyplot as plt df=pd.read_csv("data.csv") #读取文件 data.csv 中的数据
df.insert(0,"小时","") #插入列
for i in df.index: #通过行标签和列标签选取单个值
t=df.at[i,"时间"]
df.at[i,"小时"]=t[:2]
df=df.groupby("小时",as_index=False).▲ #以“小时”分组求均值
![]()
plt.bar(df.小时,df.温度)
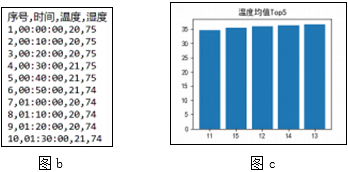
#设置绘图参数,显示如图 c 所示柱形图,代码略
①程序中划线处合适的代码是(单选, 填字母: A .sum()/B .mean()/C .count())。
②加框处的语句作用:实现获取当天平均温度高于30的所有时间段中温度最高的5个,该处代码由以下三部分组成:
A .df=df.sort_values("温度") B .df=df.tail(5) C .df=df[df.温度>30]
则加框处代码依次为 (填字母)。