图 a |
图 b |
import pandas as pd
import matplotlib.pyplot as plt
#读取如图 b 所示数据,保存到 DataFrame 对象 df1 中,代码略
f = [9, 7, 6, 5, 4, 3, 2, 1]
for i in range(0,len(dfl)):
rank = df1.at[i,"名次"] #通过行、列标签取单个值
score = 0
if rank <= 8:
df1.at[i,"得分"] = score

df2 = dfl.groupby(" ▲ ",as_index=False).sum() #分组求和
![]()
#设置绘图参数,代码略
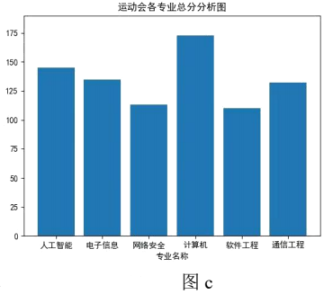
plt.bar(x,y) #绘制柱形图
①请在程序中划线处填入合适的代码。
②程序的方框中应填入的正确代码为 (单选,填字母)
A.x = df1["专业"]
y = df1["总分"]
B.x = df2["专业"]
y = df2["得分"]
C.df1["专业"] = "专业"
df1["总分"] = "总分"
D.Df2["专业"] = "专业"
Df2["得分"] = "得分"